Switch to
for
IELTS
| Powered by AI
Luyện Đề & Thi Thử
IELTS Writing Task 1 Academic
Luyện đề hoặc thi thử online miễn phí với 7 dạng bài phổ biến nhất của bài thi IELTS Writing Task 1 Academic. Nhận kết quả đánh giá ngay sau khi nộp bài.
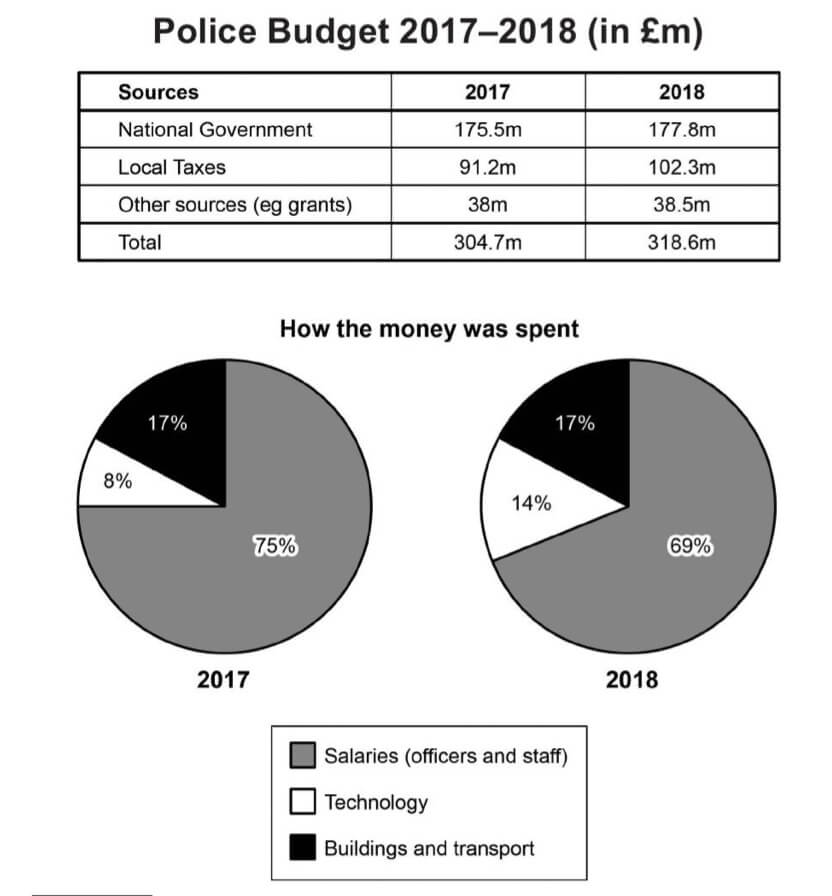
Table
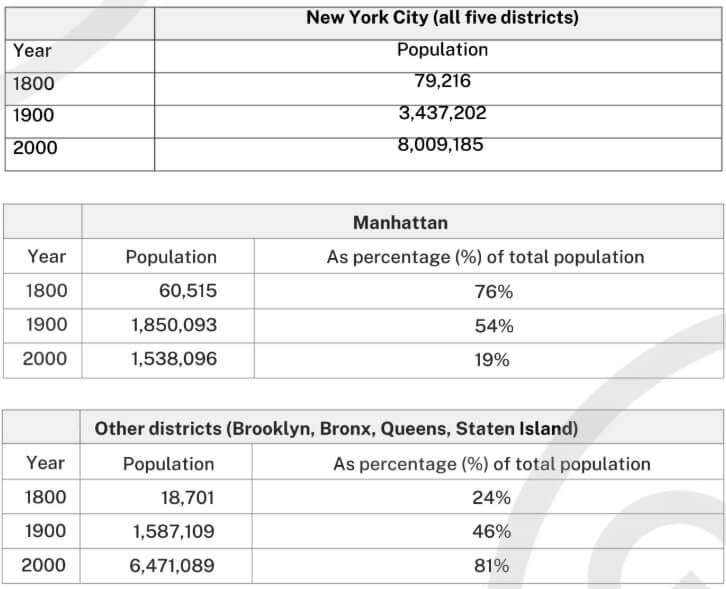
Summarise the information by selecting and reporting the main features, and make comparisons where relevant.
Write at least 150 words.
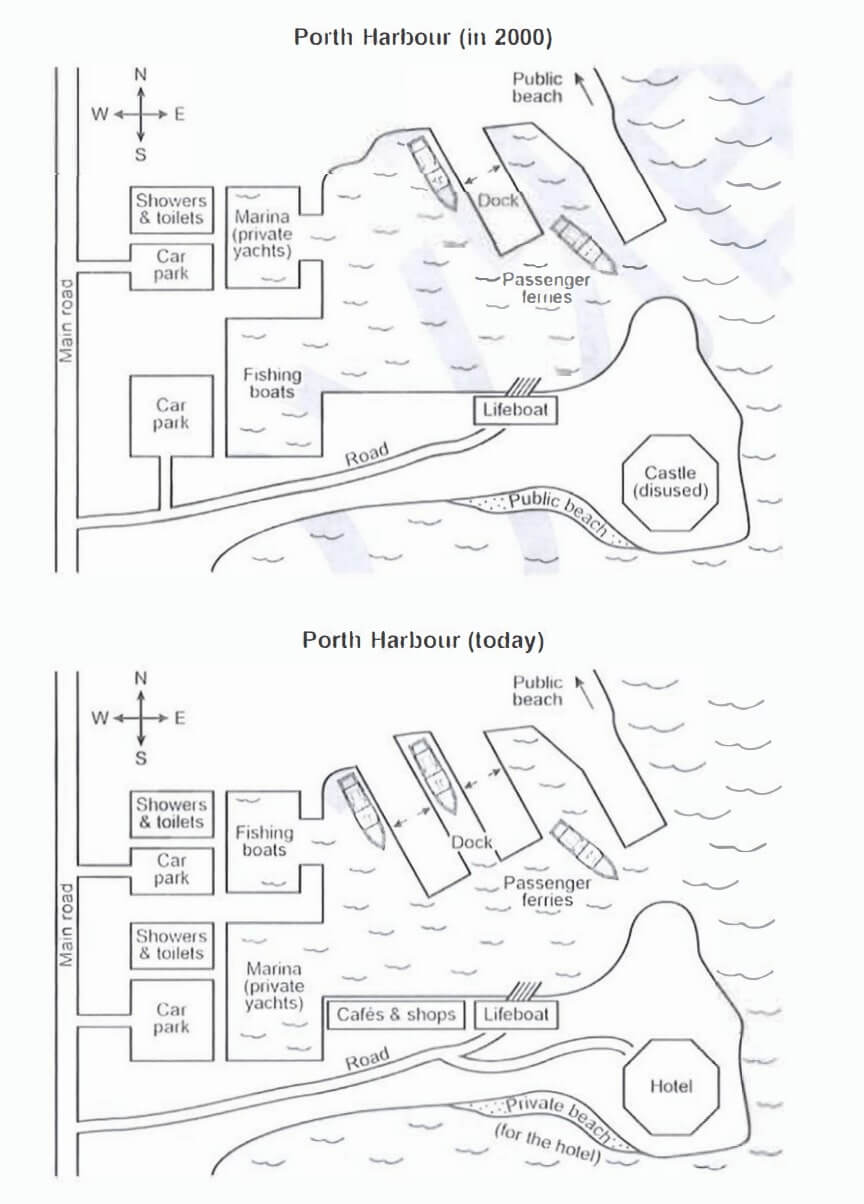
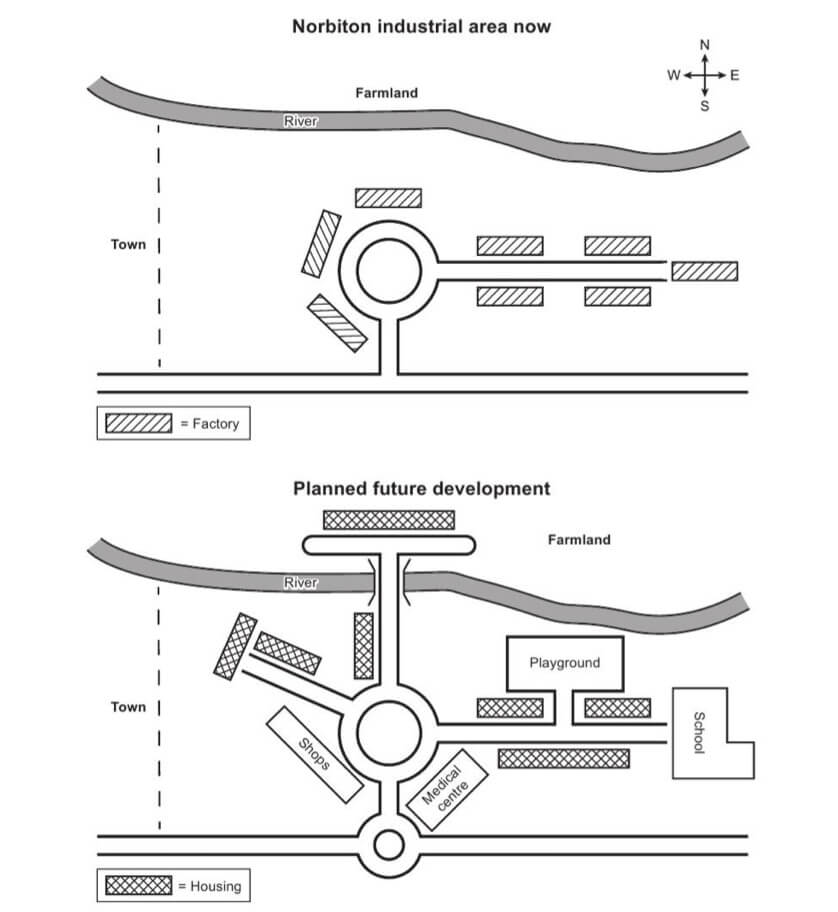
Map
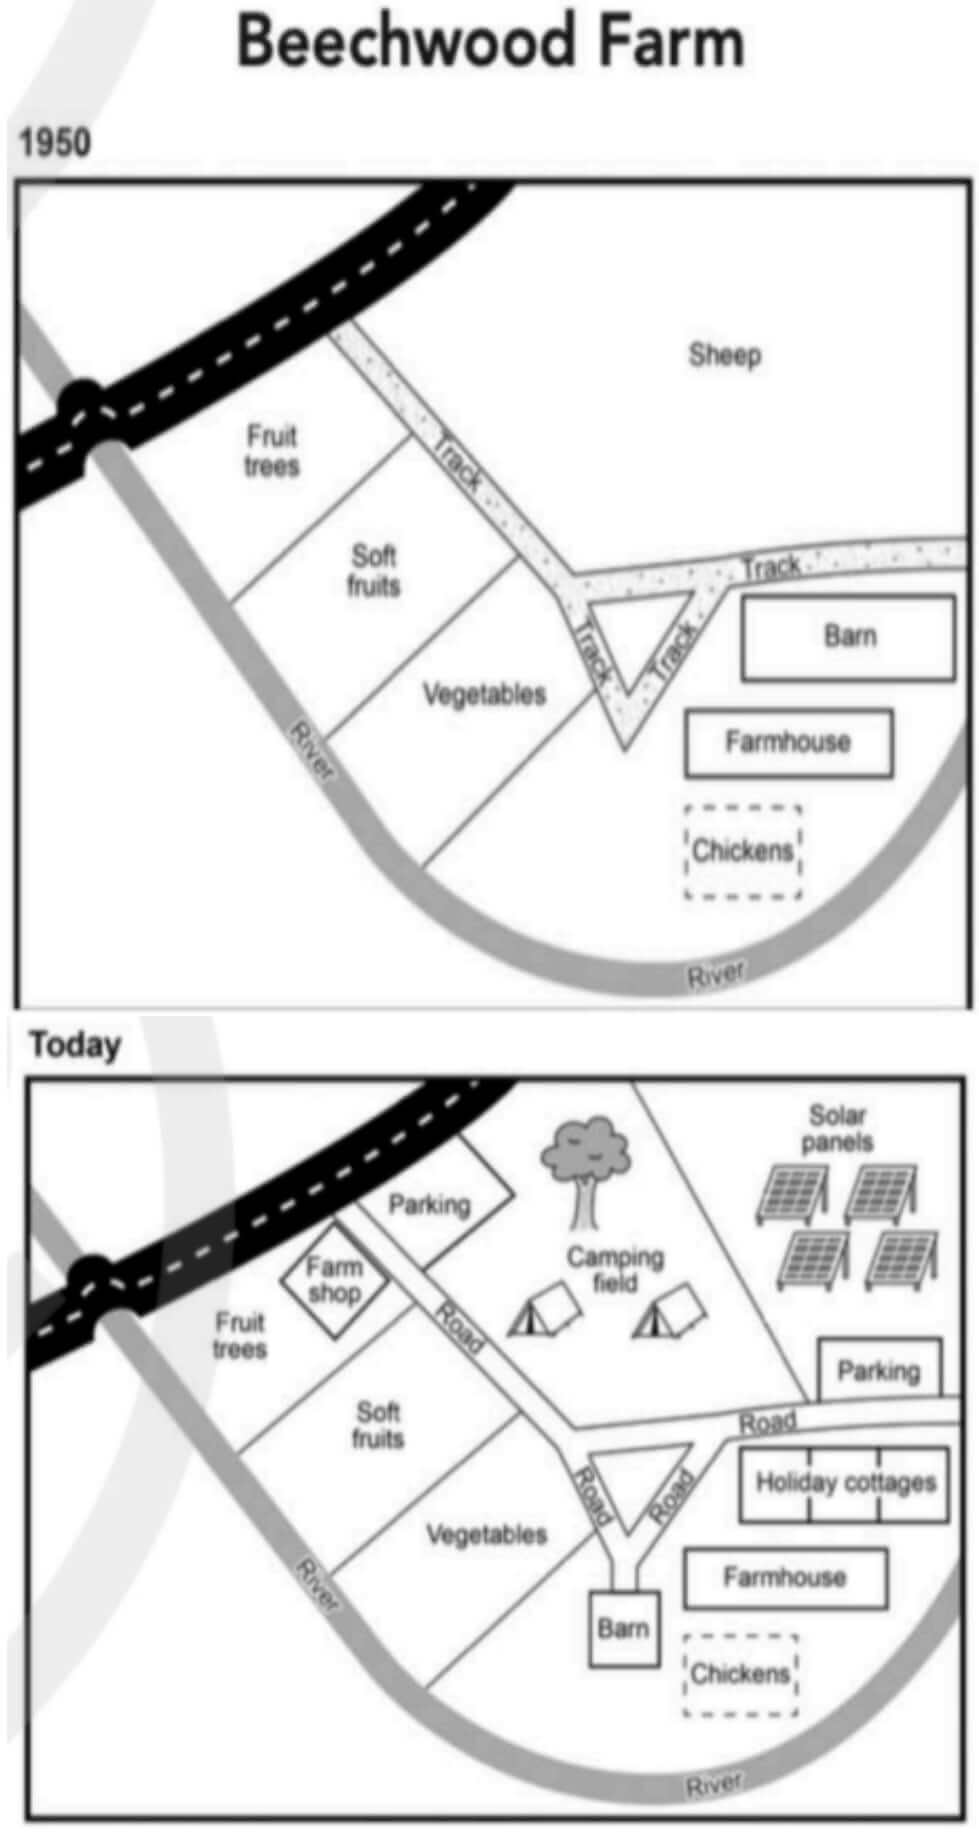
Summarise the information by selecting and reporting the main features, and make comparisons where relevant.
Write at least 150 words.
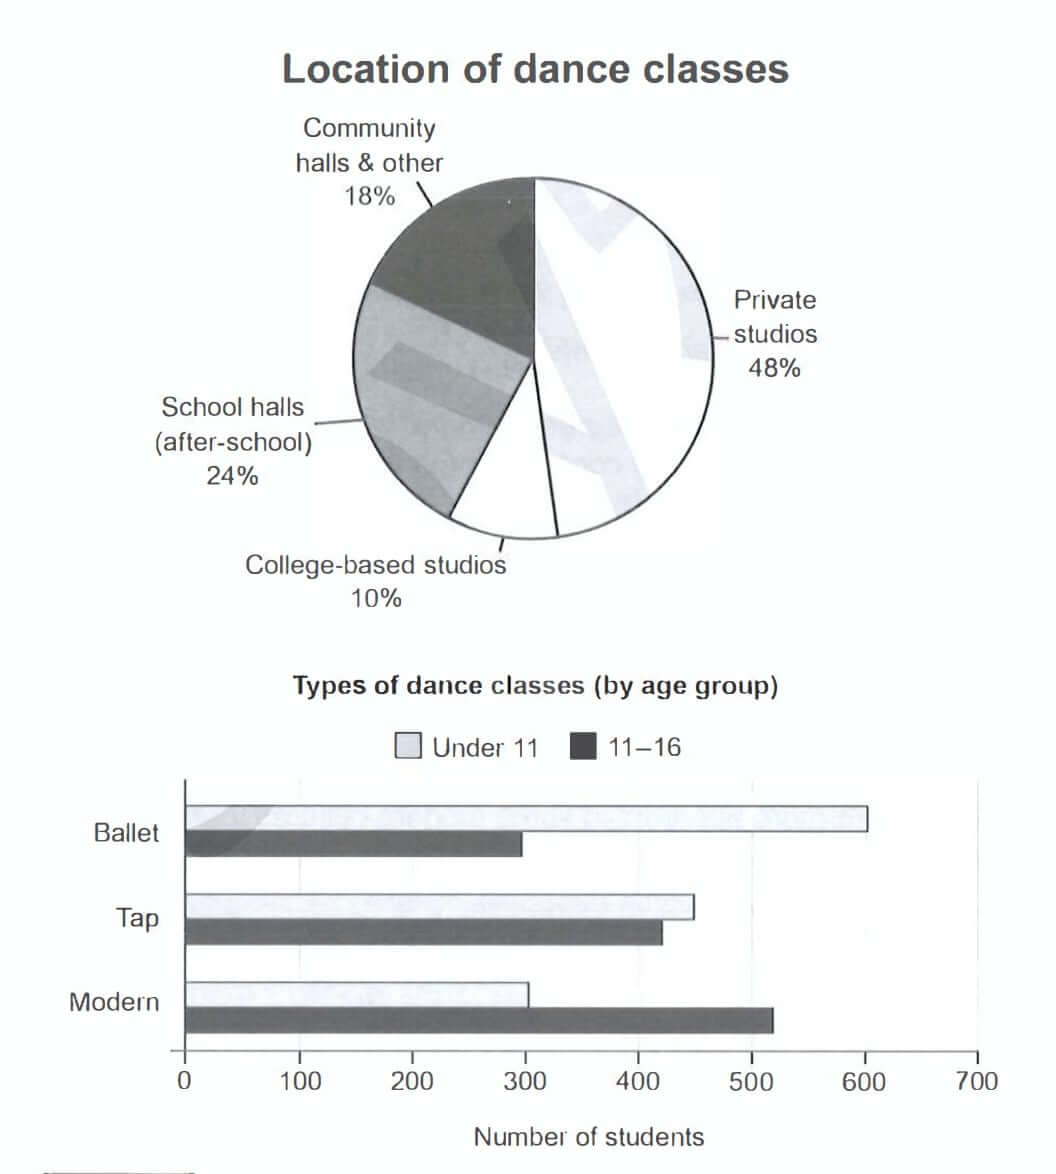
Multiple Chart
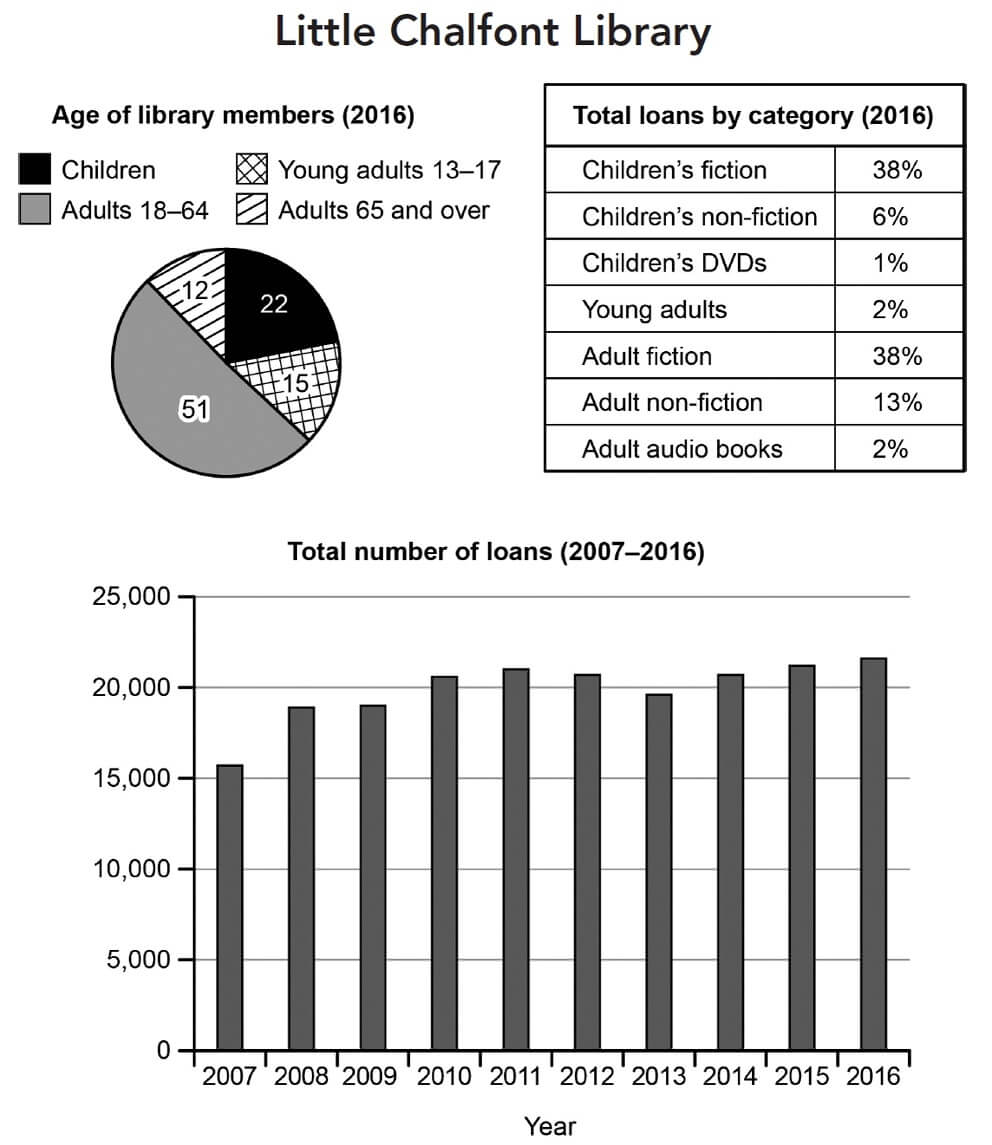
Write at least 150 words
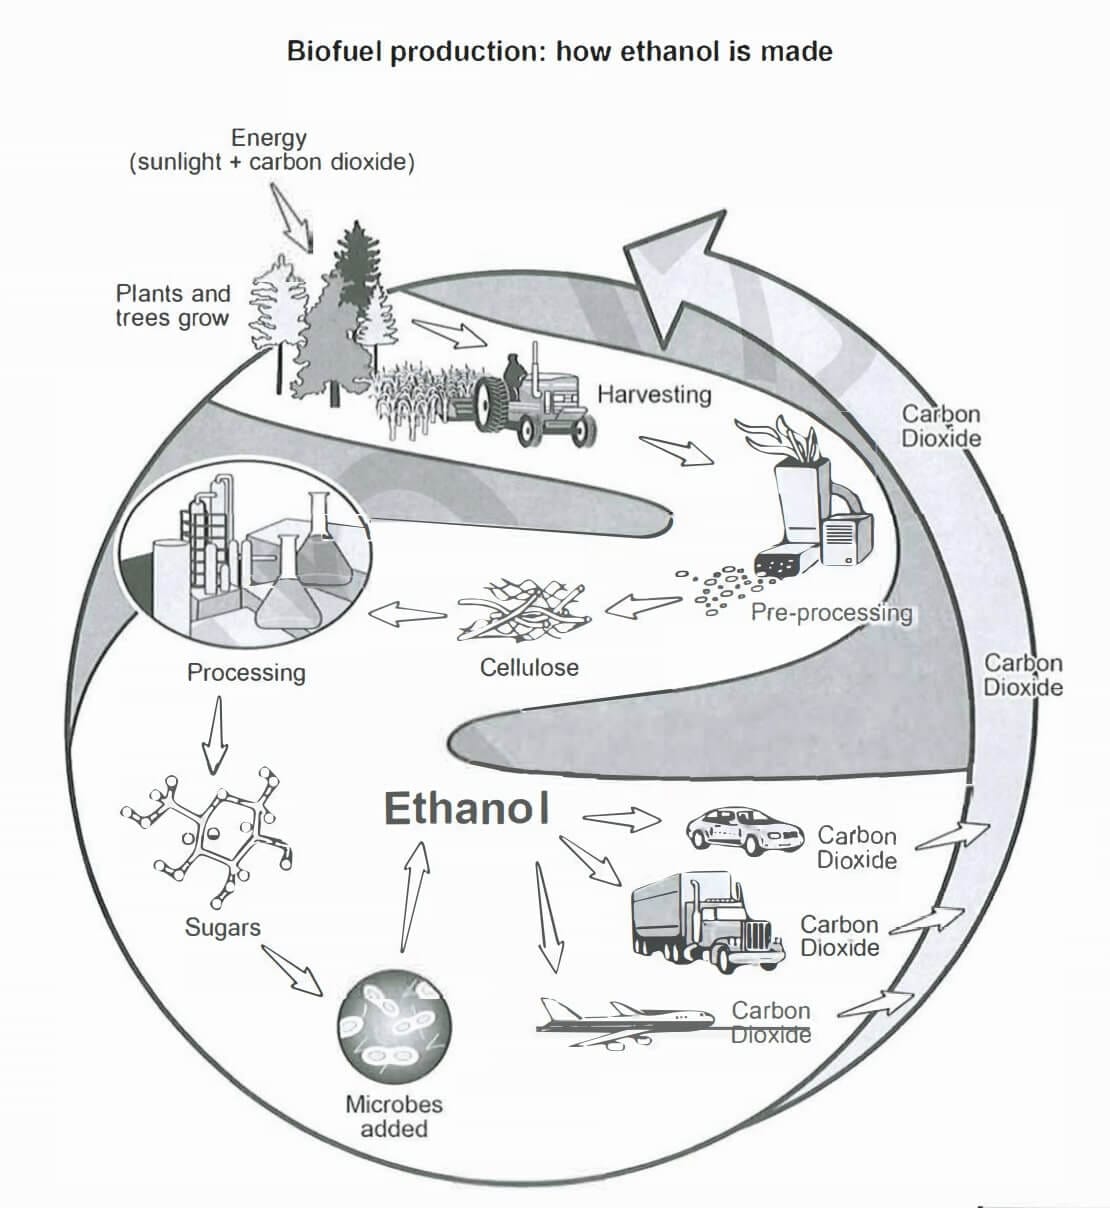
Process
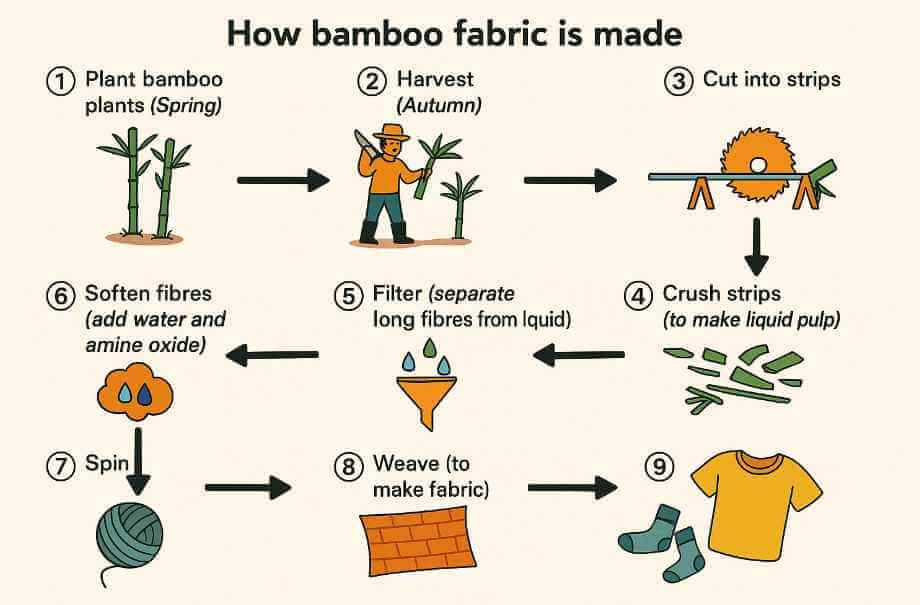
Write at least 150 words.
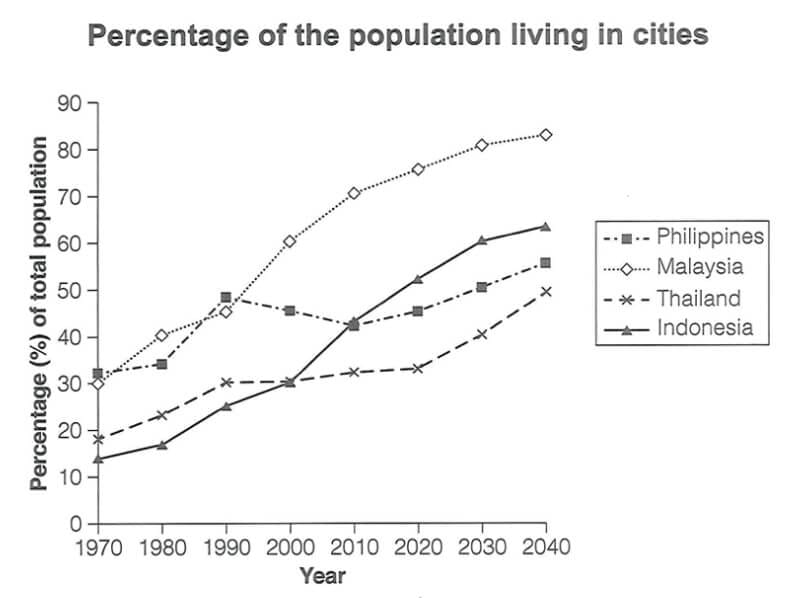
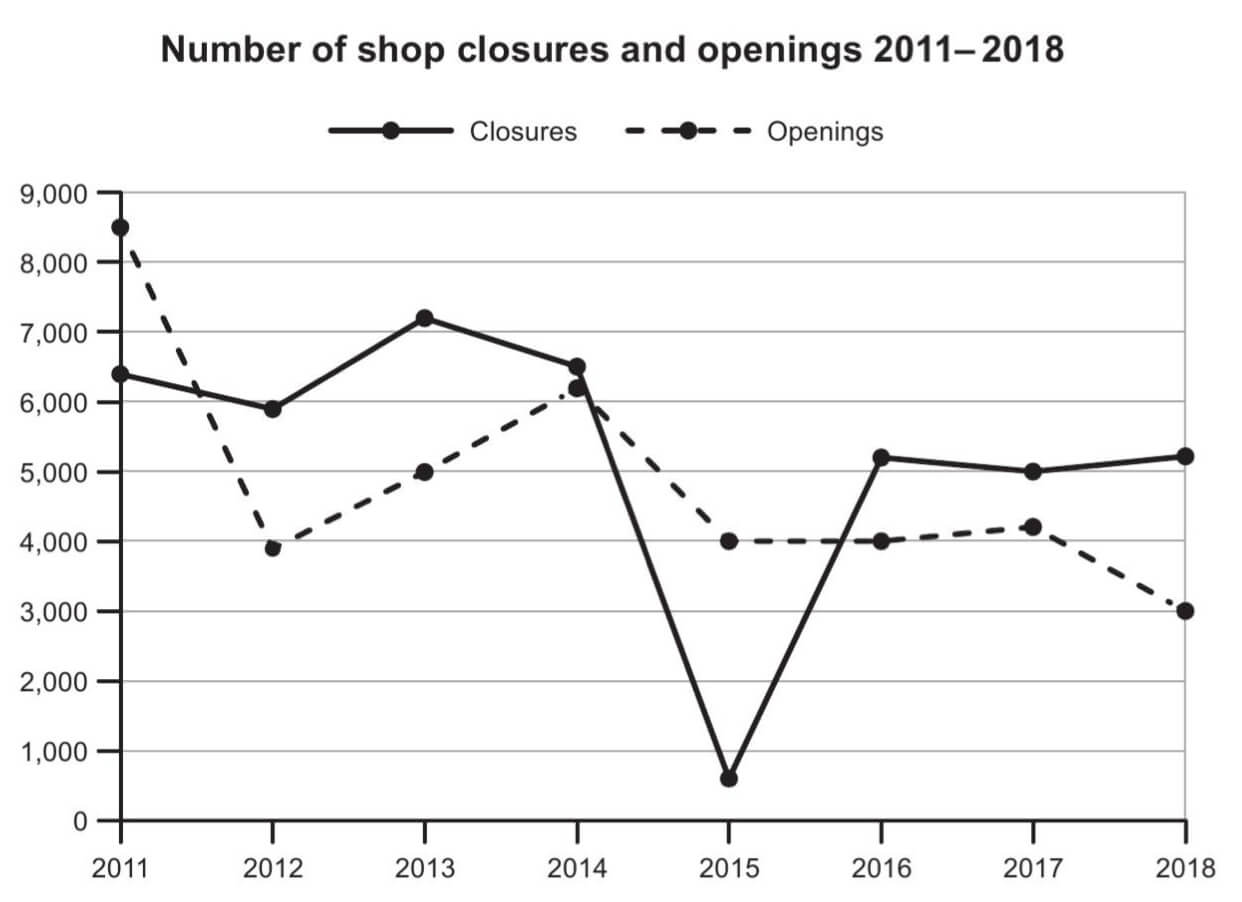
Line Chart
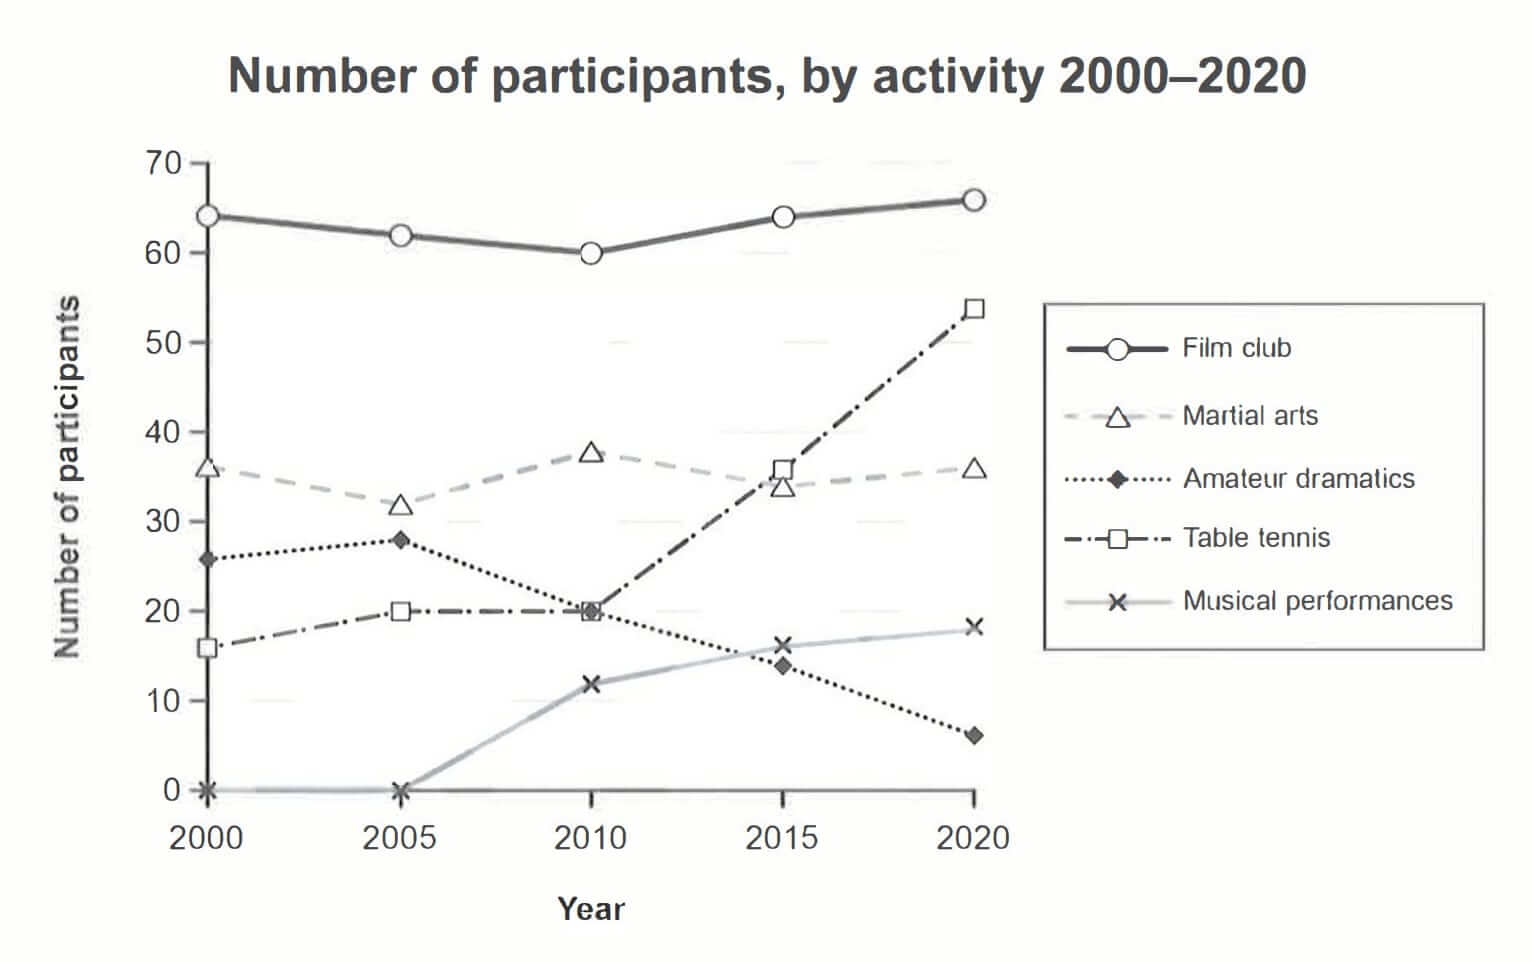
Summarise the information by selecting and reporting the main features, and make comparisons where relevant.
Write at least 150 words.
Map
Summarise the information by selecting and reporting the main features, and make comparisons where relevant.
Write at least 150 words.
Process
Summarise the information by selecting and reporting the main features, and make comparisons where relevant.
Write at least 150 words.
Multiple Chart
Summarise the information by selecting and reporting the main features, and make comparisons where relevant.
Write at least 150 words.
Line Chart
Summarise the information by selecting and reporting the main features, and make comparisons where relevant.
Write at least 150 word.
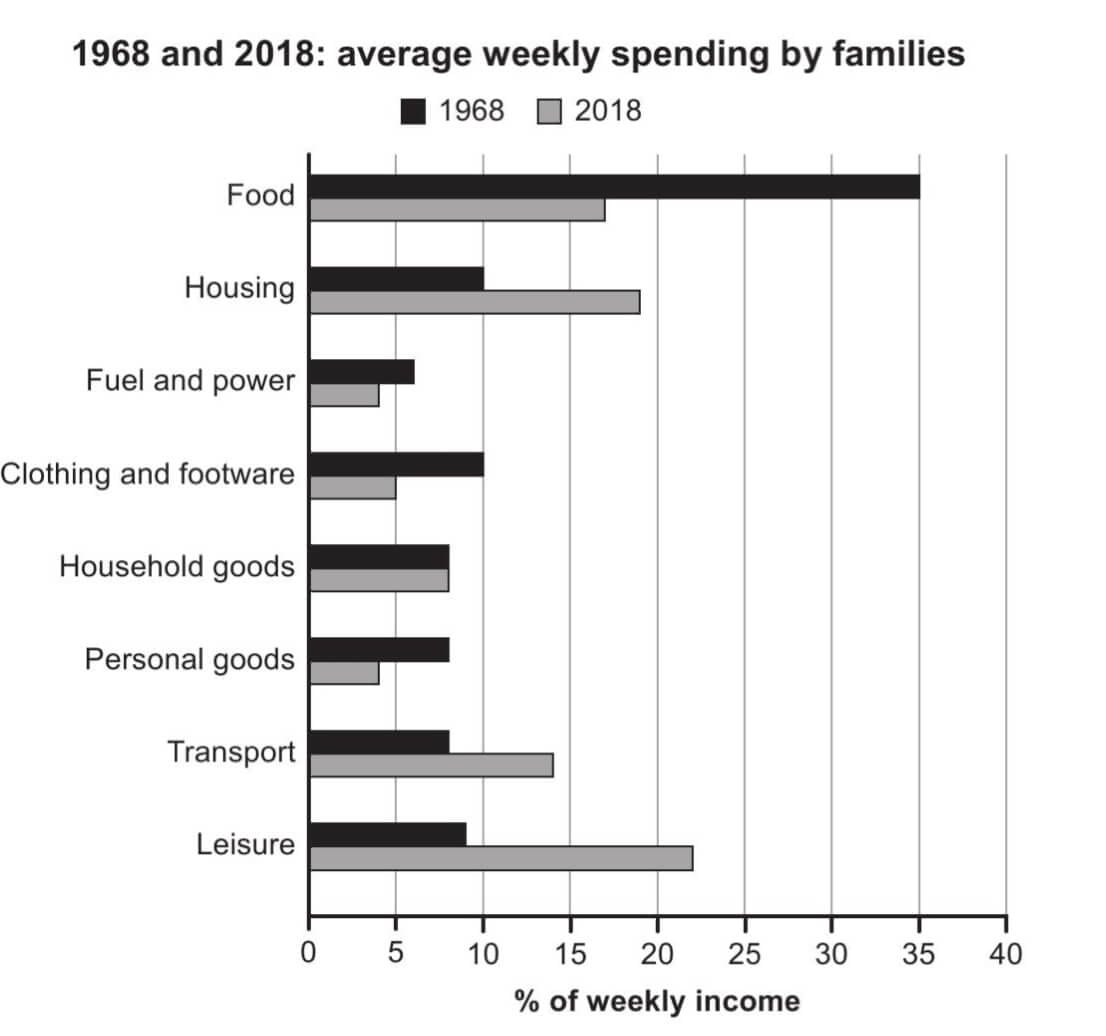
Bar Chart
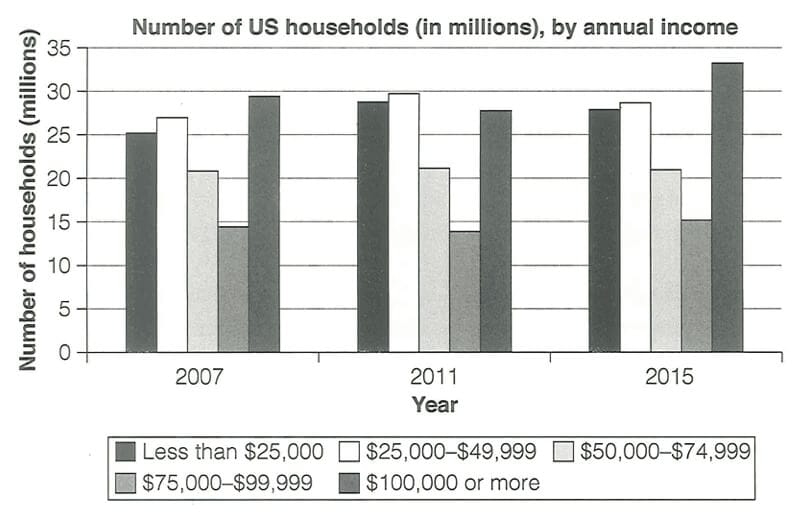
Summarise the information by selecting and reporting the main features, and make comparisons where relevant.
Write at least 150 word.
Map
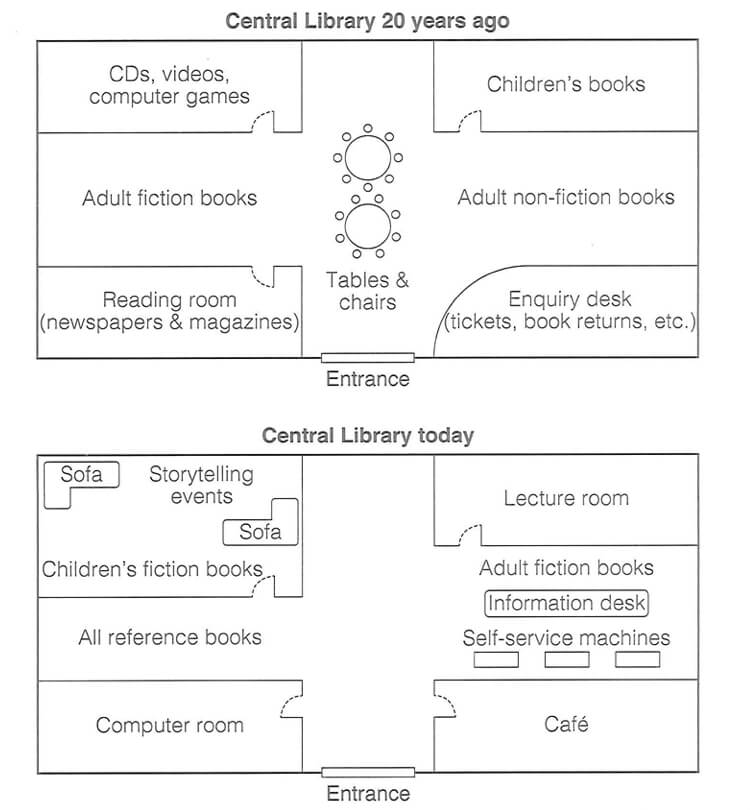
Summarise the information by selecting and reporting the main features, and make comparisons where relevant.
Write at least 150 word.
Line Chart
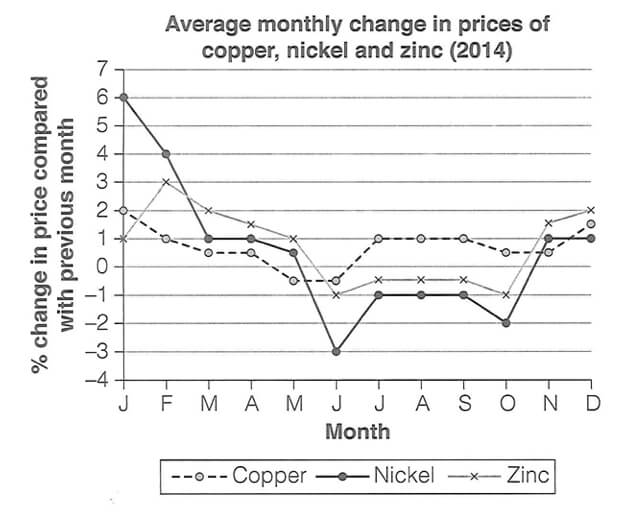
Summarise the information by selecting and reporting the main features, and make comparisons where relevant.
Write at least 150 word.
Map
Summarise the information by selecting and reporting the main features, and make comparisons where relevant.
Write at least 150 word.
Mixed Data
Summarise the information by selecting and reporting the main features, and make comparisons where relevant.
Write at least 150 word.
Bar Chart
Summarise the information by selecting and reporting the main features, and make comparisons where relevant.
Write at least 150 word.
Line Chart
Summarise the information by selecting and reporting the main features, and make comparisons where relevant.
Write at least 150 word.
Tiếp tục được cập nhật…
Nâng band nhanh chóng, tự tin hơn trước kỳ thi thật
Ôn luyện và thi thử IELTS Writing với đầy đủ các tính năng
LexiBot cung cấp đầy đủ các công cụ dành riêng cho các bạn tự ôn luyện IELTS Writing online tại nhà, với sự hỗ trợ của AI.
Mô phỏng áp lực như thi thật
Nhận đề bài hoàn toàn ngẫu nhiên và làm bài dưới áp lực thời gian như trong kỳ thi thực tế.
Kho đề bài đa dạng, phong phú
Kho hơn 5.000 đề IELTS Writing, đủ các chủ đề và dạng bài, sẵn sàng chờ bạn ôn luyện và thử sức.
AI hỗ trợ luyện viết & hỏi đáp
Với chế độ luyện tập, LexiBot AI sẽ hướng dẫn bạn giải quyết mọi chủ đề một cách nhanh gọn.
Nhận kết quả sau khi nộp bài
Nhận điểm số, đánh giá và hướng dẫn sửa bài chi tiết ngay sau khi nộp bài với LexiBot AI.
FAQs - Câu hỏi thường gặp
Giải đáp một số thắc mắc trong quá trình luyện đề và thi thử IELTS Writing Task 1 Academic.
Thời gian làm bài IELTS Writing Task 1 Academic là bao lâu?
Tổng thời gian cho phần thi Writing là 60 phút, dành cho cả Task 1 và Task 2. Task 1 được khuyến nghị dành khoảng 20 phút, vì phần này chiếm 1/3 tổng điểm Writing, đòi hỏi ít lập luận và dễ ăn điểm hơn so với Task 2.
IELTS Writing Task 1 Academic có các dạng bài phổ biến nào?
Có 7 dạng bài phổ biến trong phần thi IELTS Writing Task 1 Academic gồm:
- Biểu đồ đường (Line graph)
- Biểu đồ cột (Bar chart)
- Biểu đồ tròn (Pie chart)
- Bảng số liệu (Table)
- Biểu đồ Quy trình (Process)
- Biểu đồ Map (Bản đồ)
- Biểu đồ kết hợp (Multiple chart)
Cần viết tối thiểu bao nhiêu từ với IELTS Writing Task 1 Academic?
Bài thi IELTS Writing Task 1 Academic yêu cầu thí sinh viết tối thiểu 150 từ, bạn nên cố gắng viết đủ số từ tối thiểu, nếu viết ngắn hơn, có thể gây ảnh hưởng tới điểm số.
Đề IELTS Writing Task 1 Academic và General Training có khác nhau không?
Có. IELTS Writing Task 1 Academic yêu cầu thí sinh mô tả, so sánh số liệu từ biểu đồ, bảng, sơ đồ hoặc quy trình. Ngược lại, Task 1 General Training tập trung vào viết thư trong các tình huống đời sống như yêu cầu thông tin, khiếu nại hay xin lỗi.
Có giới hạn về tổng số từ cho bài IELTS Writing Task 1 Academic không?
Không có giới hạn tối đa về số từ trong bài thi IELTS Writing Task 1 Academic. Tuy nhiên, khoảng an toàn là 150 – 200 từ. Việc viết quá dài không đồng nghĩa với sự hiệu quả và điểm số cao hơn, không những thế, còn chiếm dụng thời gian soát bài.
Lorem Ipsum is simply dummy text of the printing and typesetting